How to created Symptom, Alert Definition and Notification Step by Step
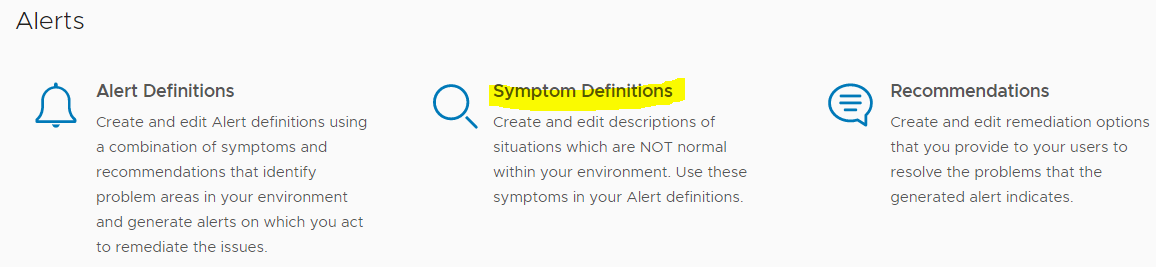
Create and edit Alert definitions using a combination of symptoms and recommendations that identify problem areas in your environment and generate alerts on which you act to remediate the issues.
Create and edit descriptions of situations which are NOT normal within your environment. Use these symptoms in your Alert definitions.
Create and edit remediation options that you provide to your users to resolve the problems that the generated alert indicates.
Steps to create Symptoms in vROPS….
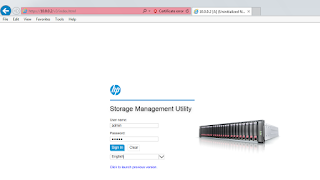
Login to vROPS
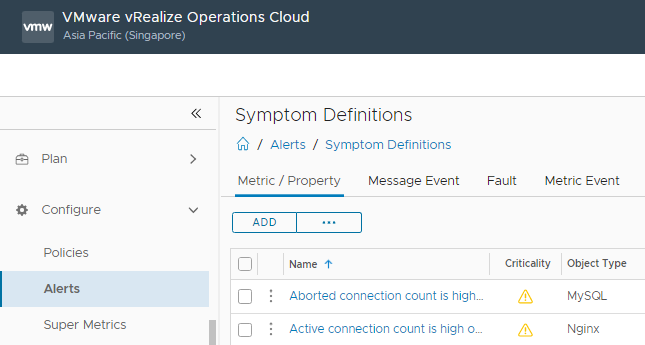
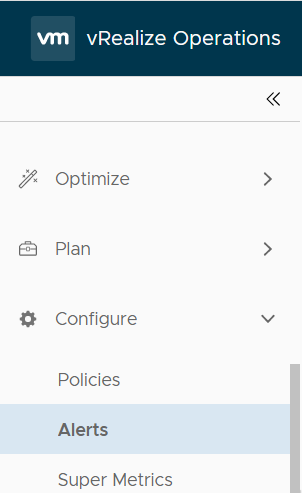
Click Alerts under Configure
Click on Symptom Definitions
Click Add
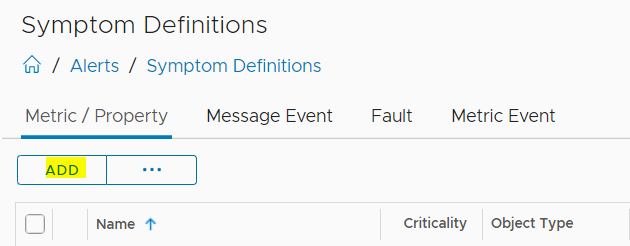
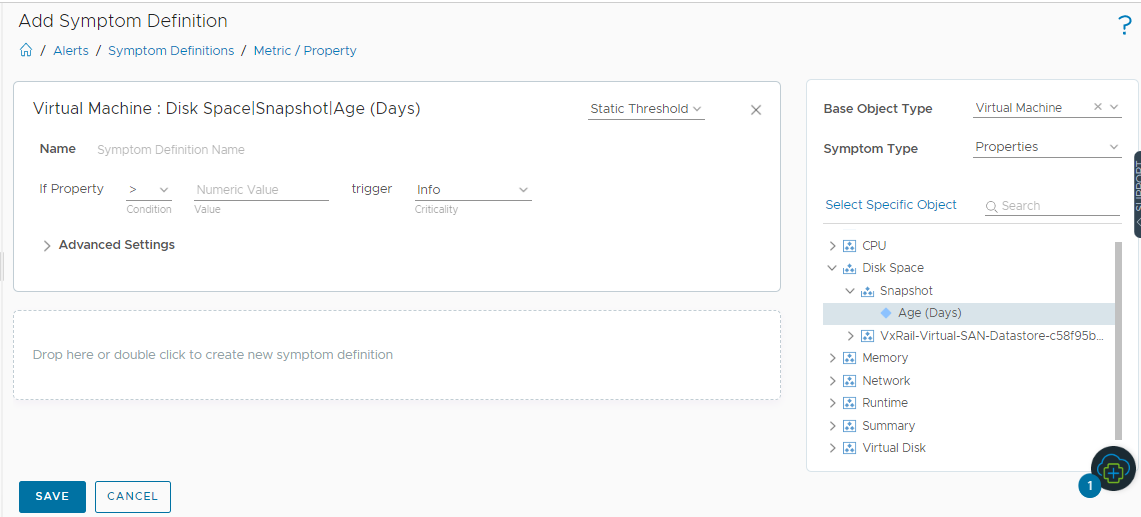
Click Add
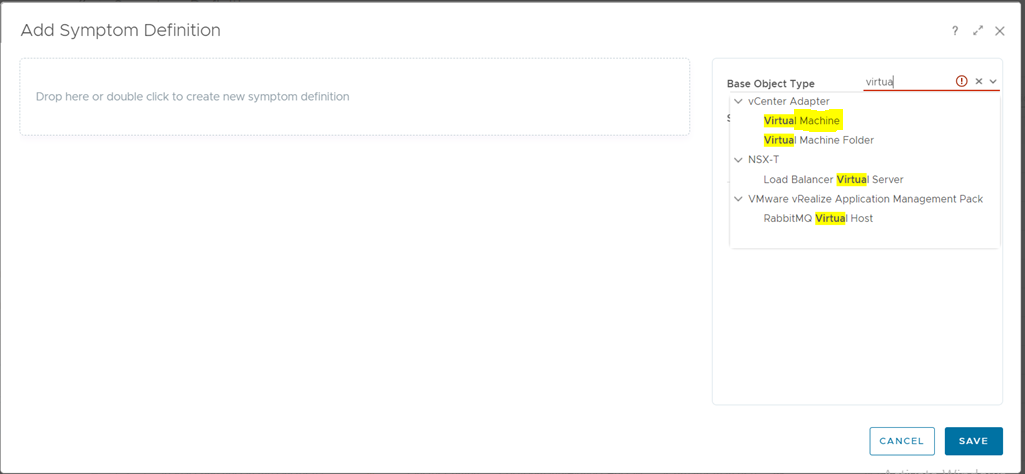
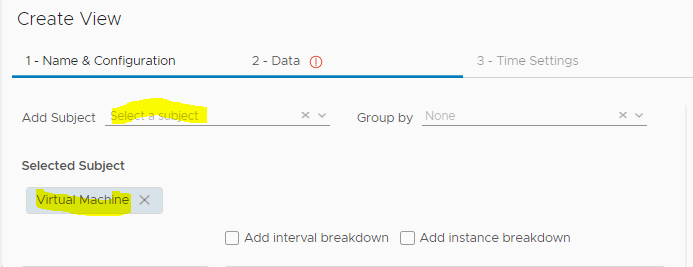
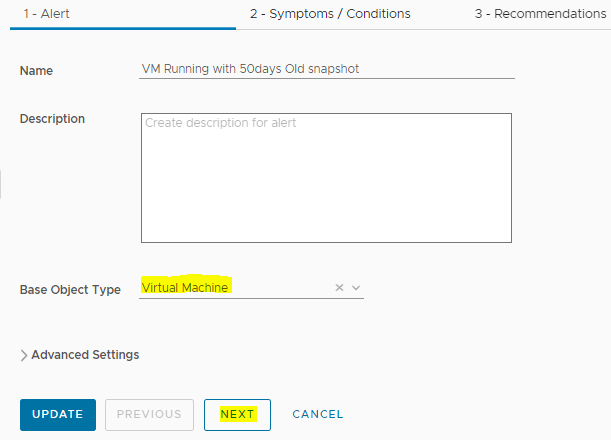
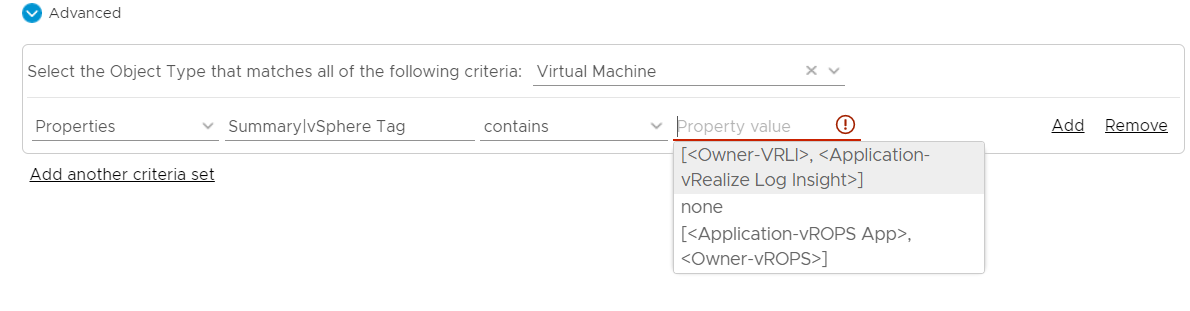
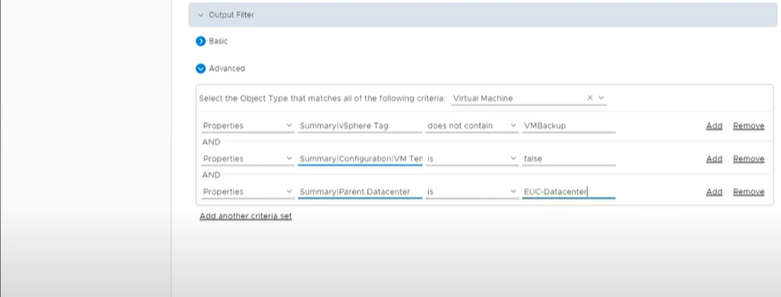
In Base Object Type -: Type Virtual Machine
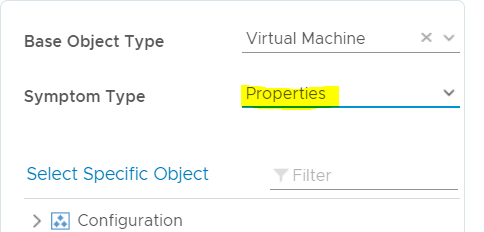
In Symptom Type:- Select Properties
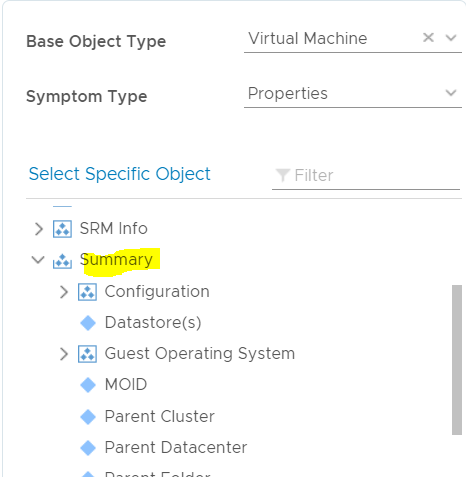
Expend Summary
Select vSphere Tag -> Drag and drop
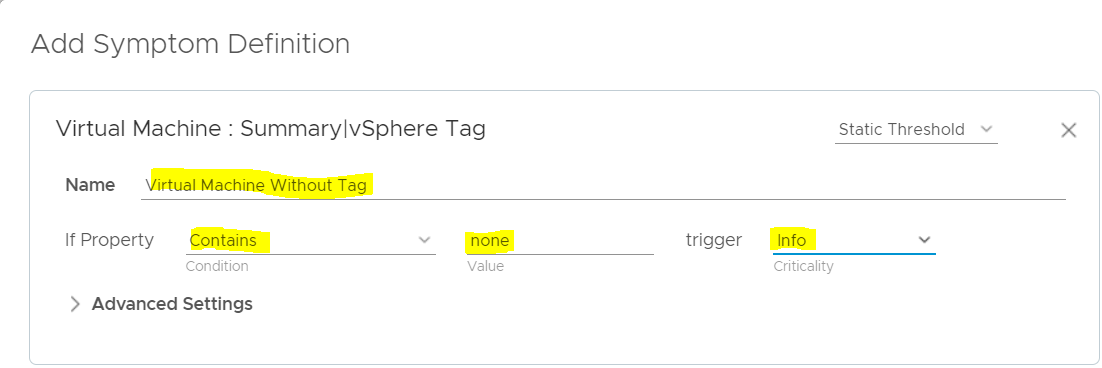
Save
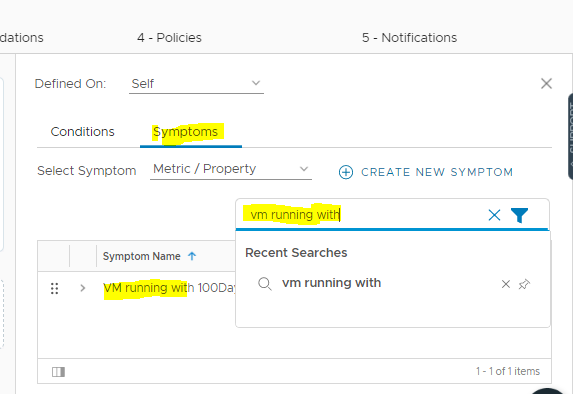
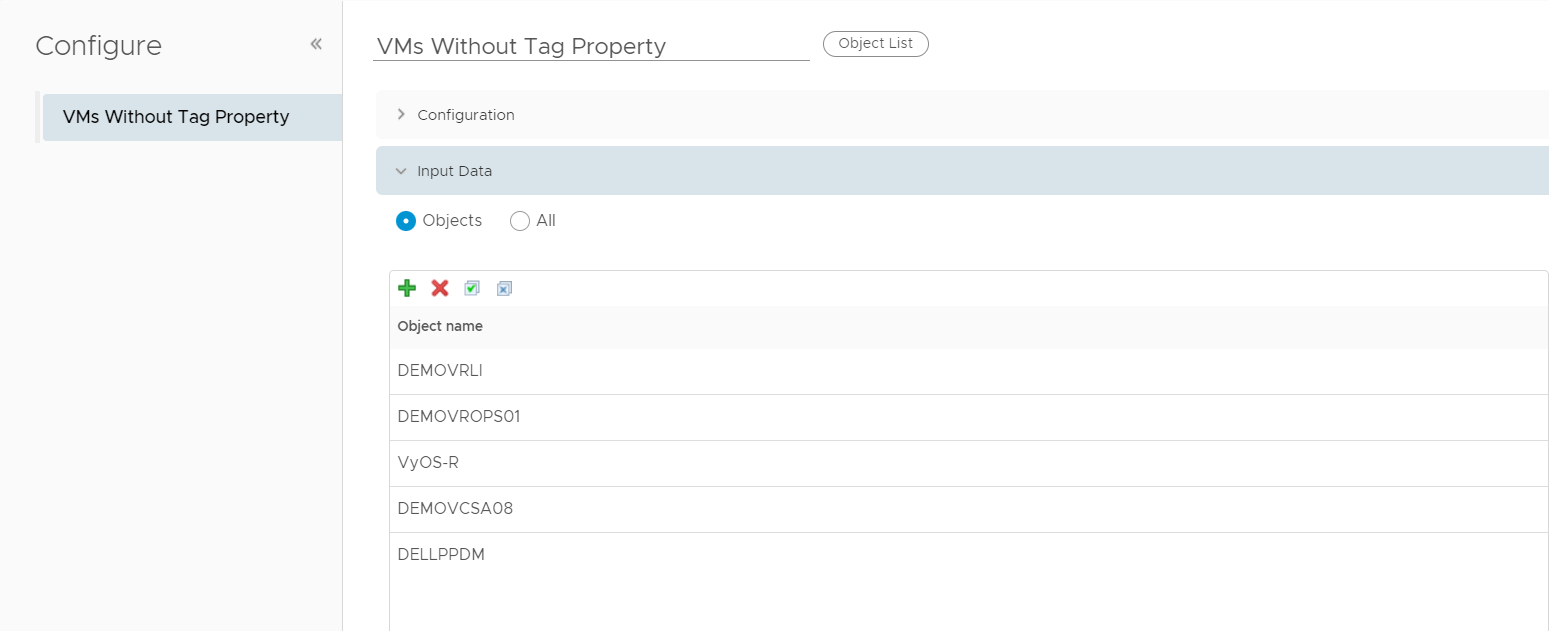
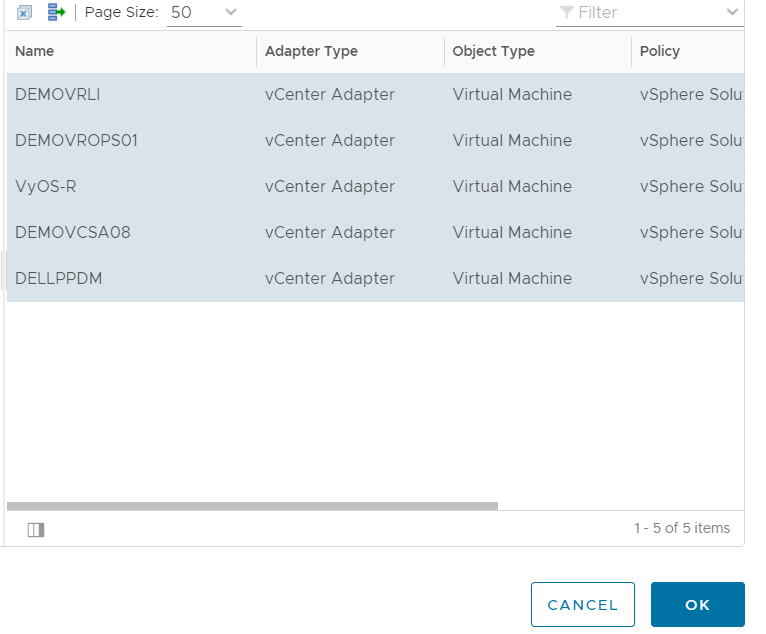
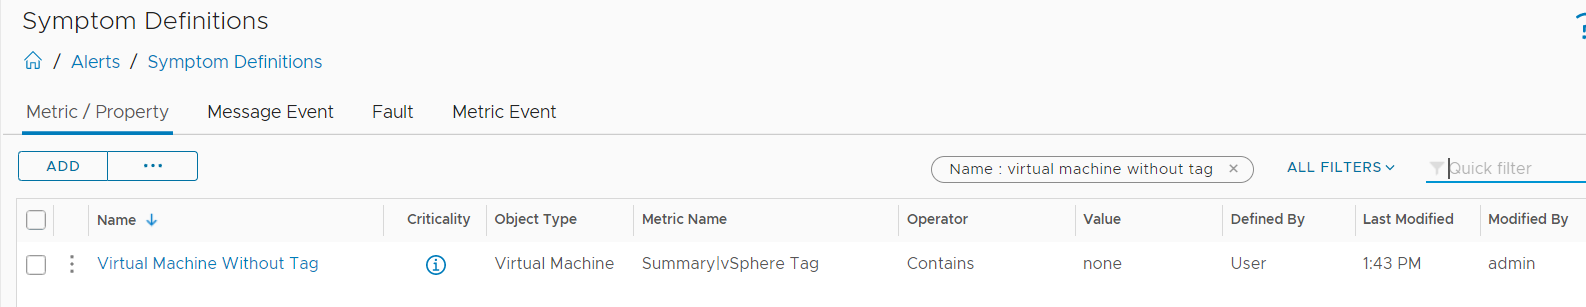
Filter with symptom Name -: “Virtual Machine without Tag”
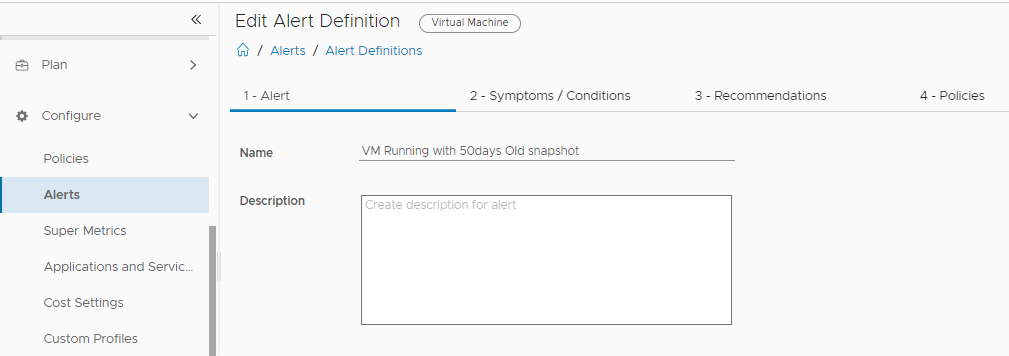
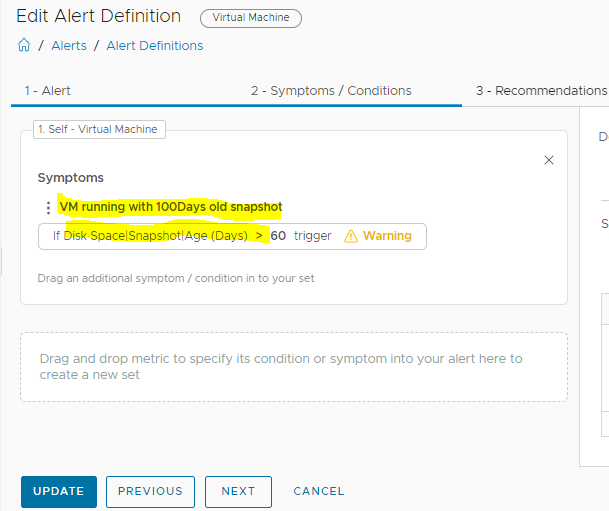
2. How to create Alert Definition
Now create Alert Definition
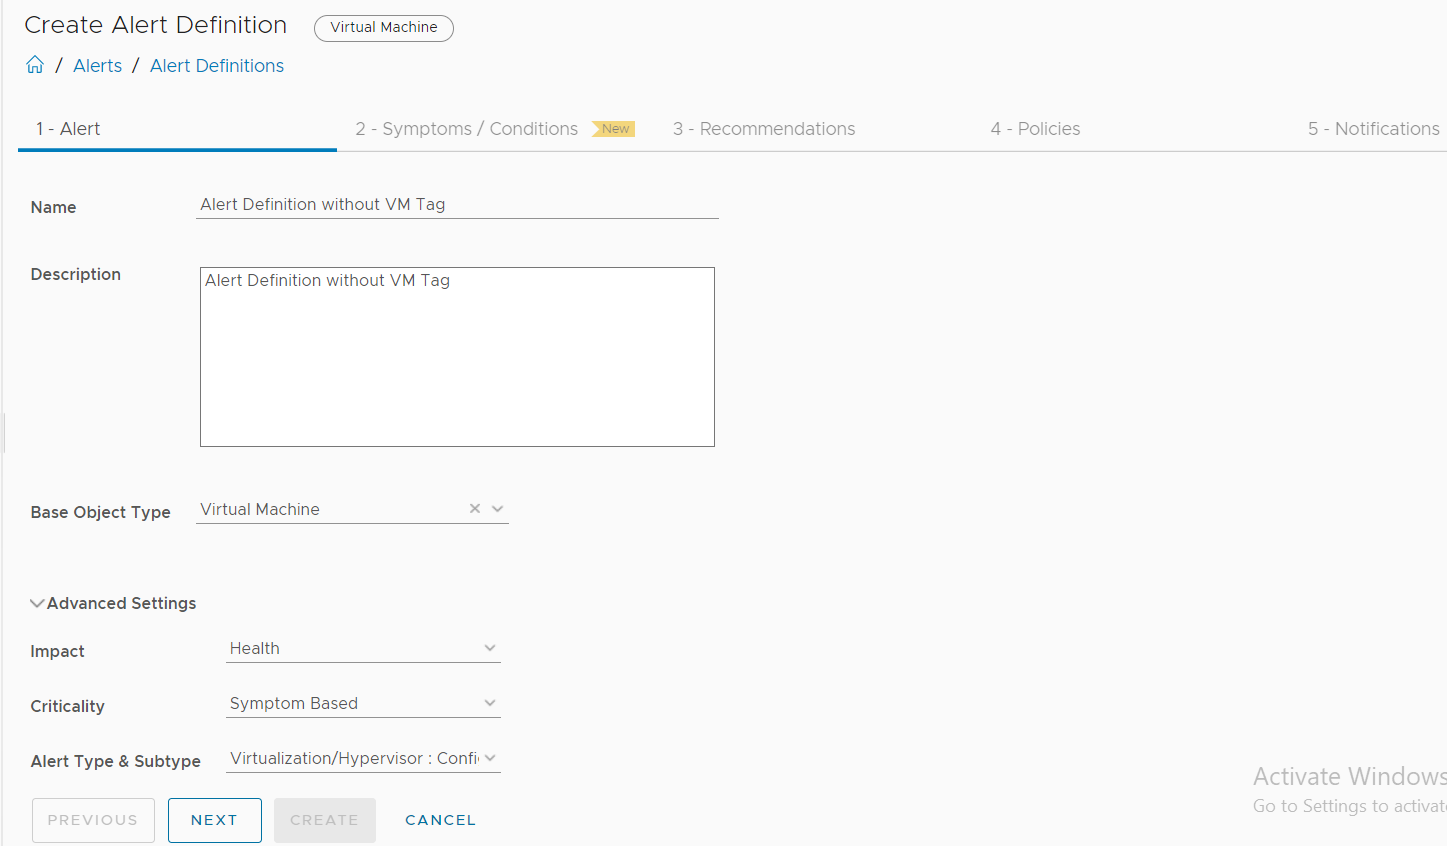
Click Next
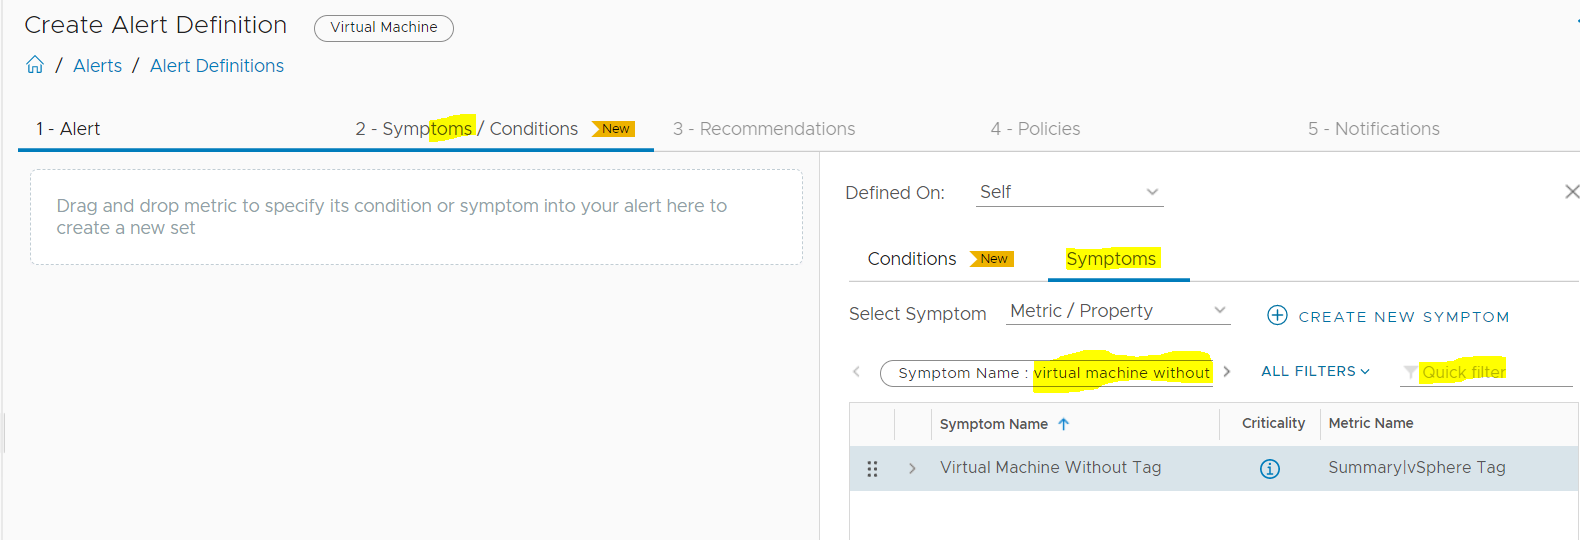
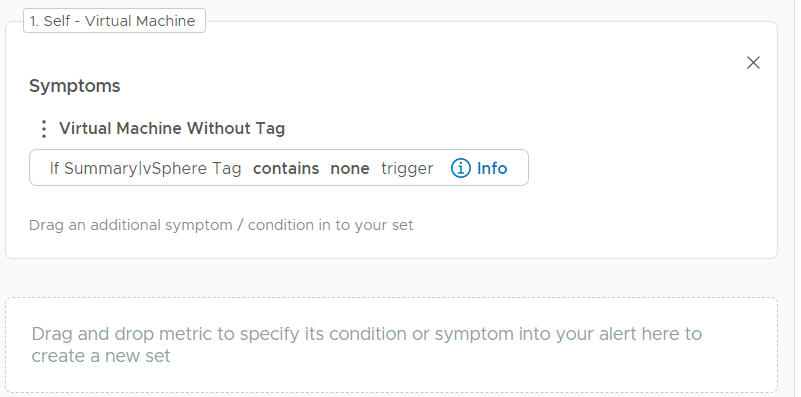
Select Symptoms -> Filter -> Type Newly created Symptoms “Virtual Machine Without Tag”
Drag and Drop Symptom
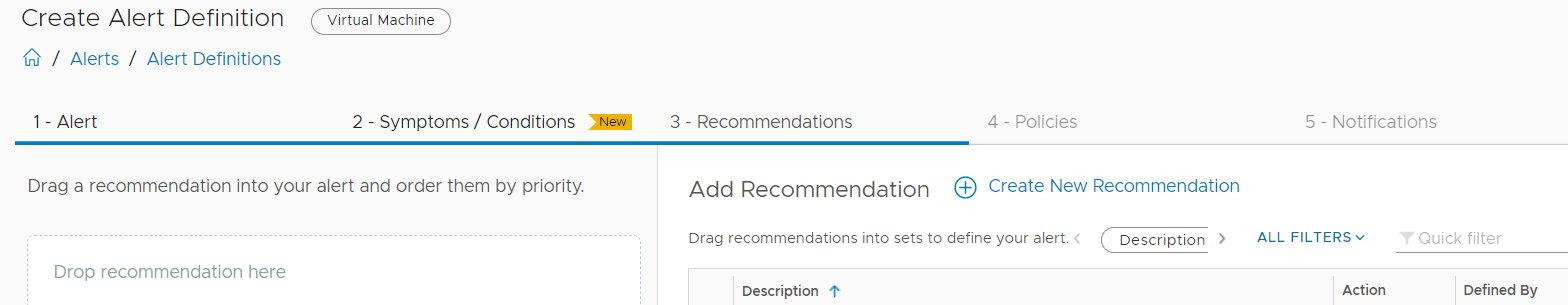
Click Next and assign Recommendation -> In my case I am not assigning recommendation
Click Next
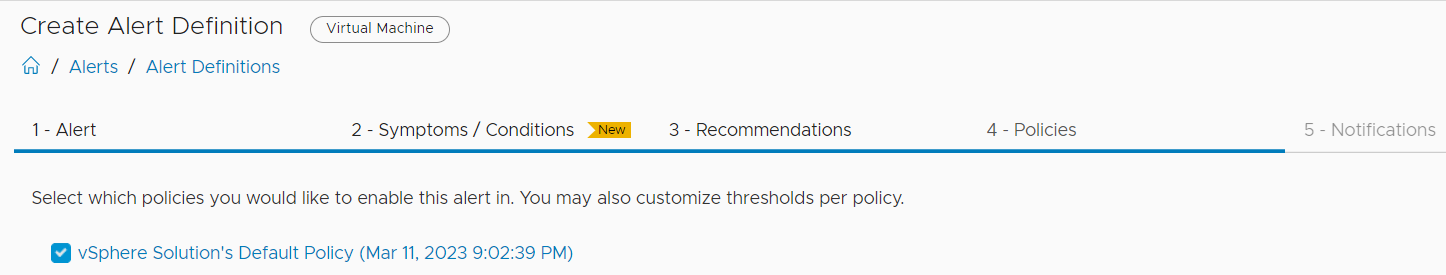
Select Policies
Click Create
Now all done
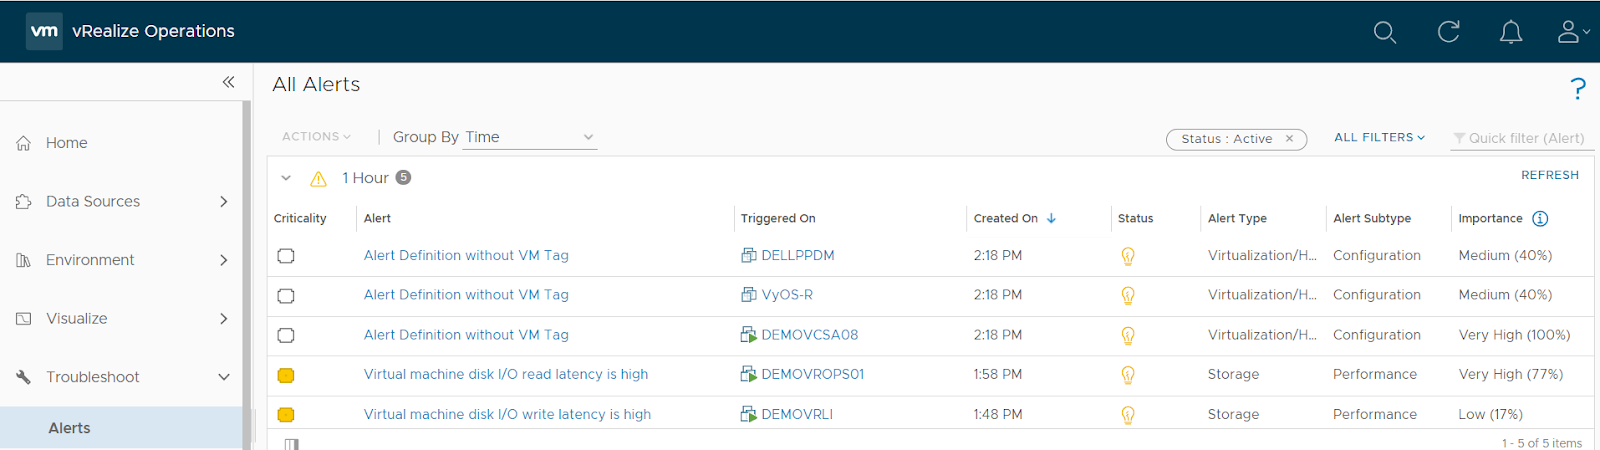
Click Alert -> under the troubleshooting tower and see all triggered alerts.