What is vROPS and how to Check Network Utilization on Physical Interface using vROPS VMWare.
Or
Generate Physical Interface Network
Utilized Report in VMWare using vROPS.
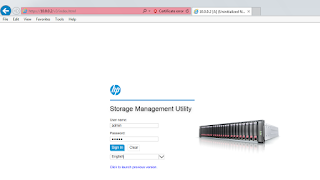
Login to vROPS

Click on Object Browser under Environment

Click integrated vCenter from Object
browser -> Expend Select datacenter or cluster.

Click Metrics -> Click calendar and select the date & time range

Click Metrics > Expend it
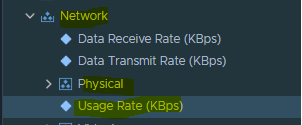
Click Network -> Physical and click on
Usage Rate
In the right-side next page, you will see
usage in graph