Custom Dashboard for Tracking VM Growth
Creating a view which shows the change over a time frame
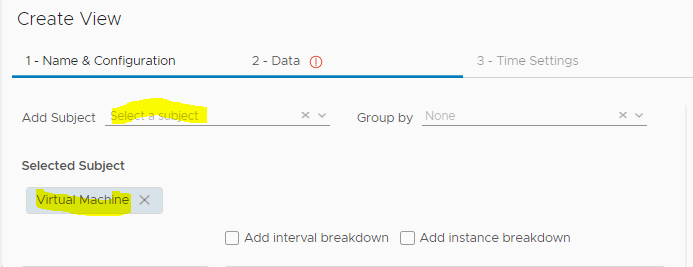
Create a new view, and provide a name
Select “list” for presentation

Click Next
Under Subjects, select under vCenter Adapter > Virtual Machine

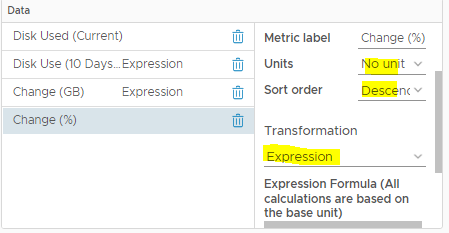
I clicked 4 times on Virtual Machine Used, to add 4 Data type Metric and then rename
the Metric label
Disk Used (Current)
This metric stays the same, showing the current disk usage of the VM.
I just altered the metric label.
Disk Used (10 days ago)
This metric is the same as the above, however I edit the configuration under transformation
selecting the
“expression option”.
For the expression formula I simply choose first.
This configuration will show the metric that has first been recorded in this view.
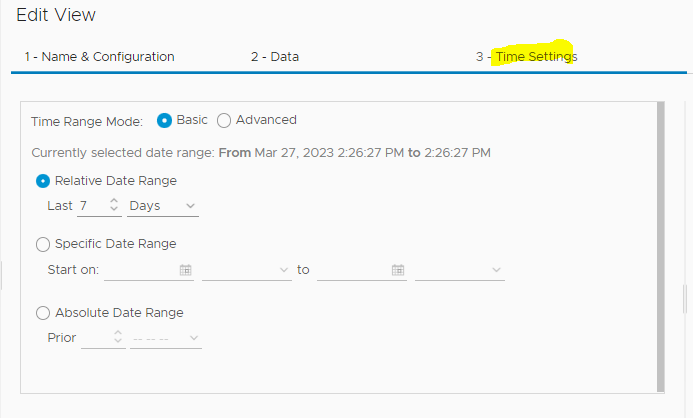
How do we ensure this shows the data from 3 days ago? Or 7 or 14 or 21, or
whatever you want?
We use Time Settings Tab to control this,
which is discussed further on.

Change (GB)
This metric gives us the change between todays value and the value as of 3 days ago
(or whatever time frame you set)
Again, we are doing something similar as above by using the expression formula feature.
The math is simple = Current (metric recorded) minus First (metric recorded).

- Change (%)
This last metric will use a slightly more advanced settings and calculations - to give us the percentage of change.
I set the sort order to Descending, to show the largest value’s first.
This will mean my view will show the VMs with the largest data growth - over X days first.
Once again, I use a transformation expression to work out the percentage.
Current value minus the First recorded value.
Divide the output by the first value and multiple by 100 to give me.- the change in a percentage.
I then also set some metric coloring. So, - if the percentage change is 30% or higher,
- it will show as red.

Output of recently created view

Reference link https://veducate.co.uk/vrops-dashboard-vm-growth/
Introduction to VMware vROPS vRealize Operations Manager
Create
Symptom Definition & Alert in vROPS
vROPS Create Custom Symptom, Alert
Definition and Notification Step by Step


No comments:
Post a Comment