What is group in SCOM and how to create and manage Dynamic Group in SCOM 2019

 Group in SCOM:-

Groups are logical grouping of different types of objects within the Operation console; it may be server, application, services or any particular object. 

So it really helps to target while configuring any particular alert or rules or monitors.

Also you can target it to configuring the notification subscriptions.

Groups are defined in the Sealed or Unsealed Management Pack.


Two Types of group in SCOM

  1. Dynamic Group

  2. Manual Group


Manual Group:-So in the manual method, you have to add the group members manually by searching it one by one.


Dynamic Group:- In Dynamic group, you can write your own discovery queries, which will help to discover the different types of objects.

Whenever any new object is being added, added into the environment, it will be automatically discovered


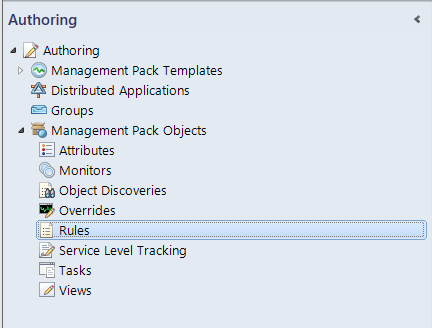
How to Create Group in SCOM

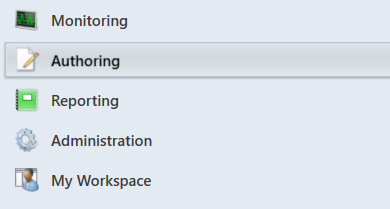
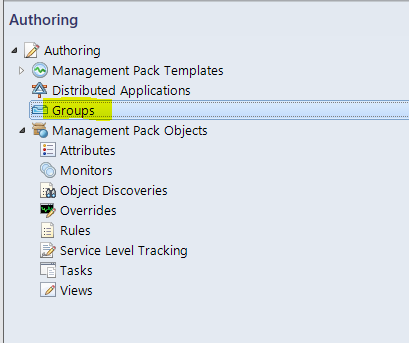
Login to SCOM Operation manager Console -> Click Authoring
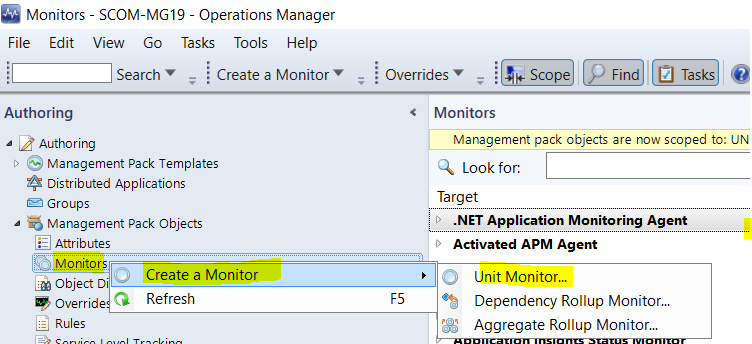

Click Groups


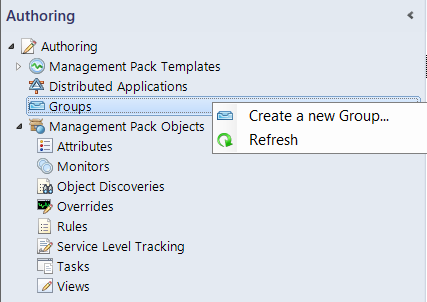
Right Click and select create a new Group


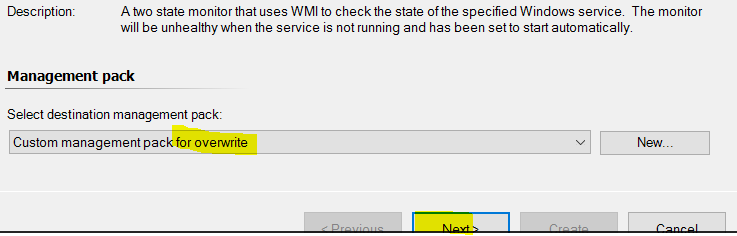
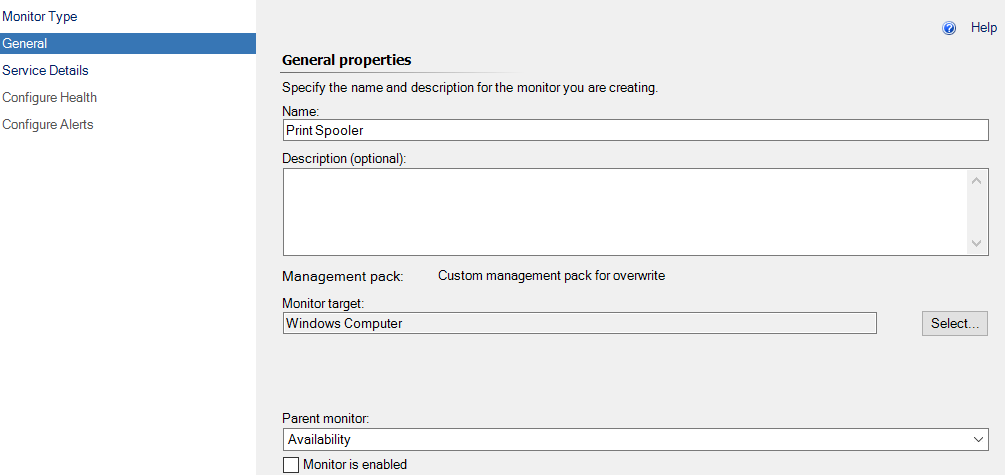
Type group Name and assign Management Pack (Custom Management pack for overwrite)


Click Next

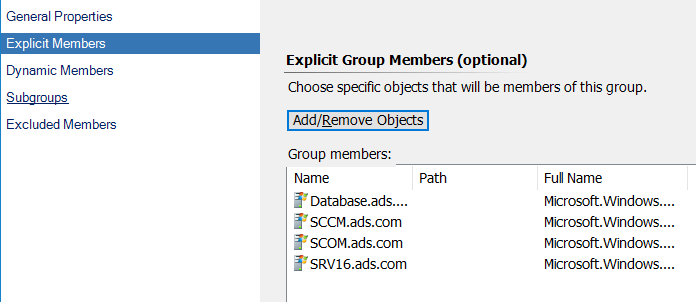
Click Add/Remove Objects

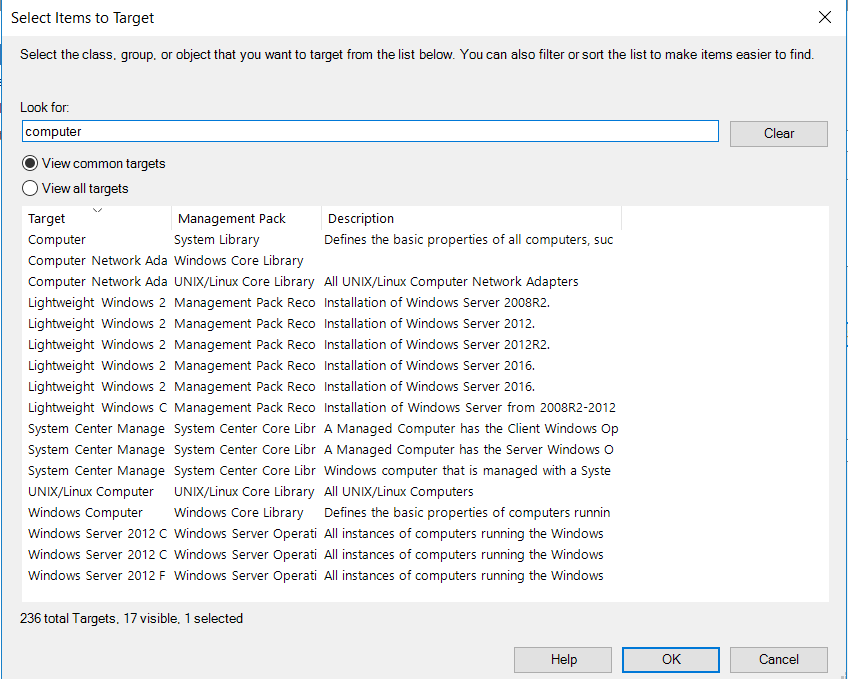
Search for: Select Windows server

Filter by part of name: Click search and select the available items


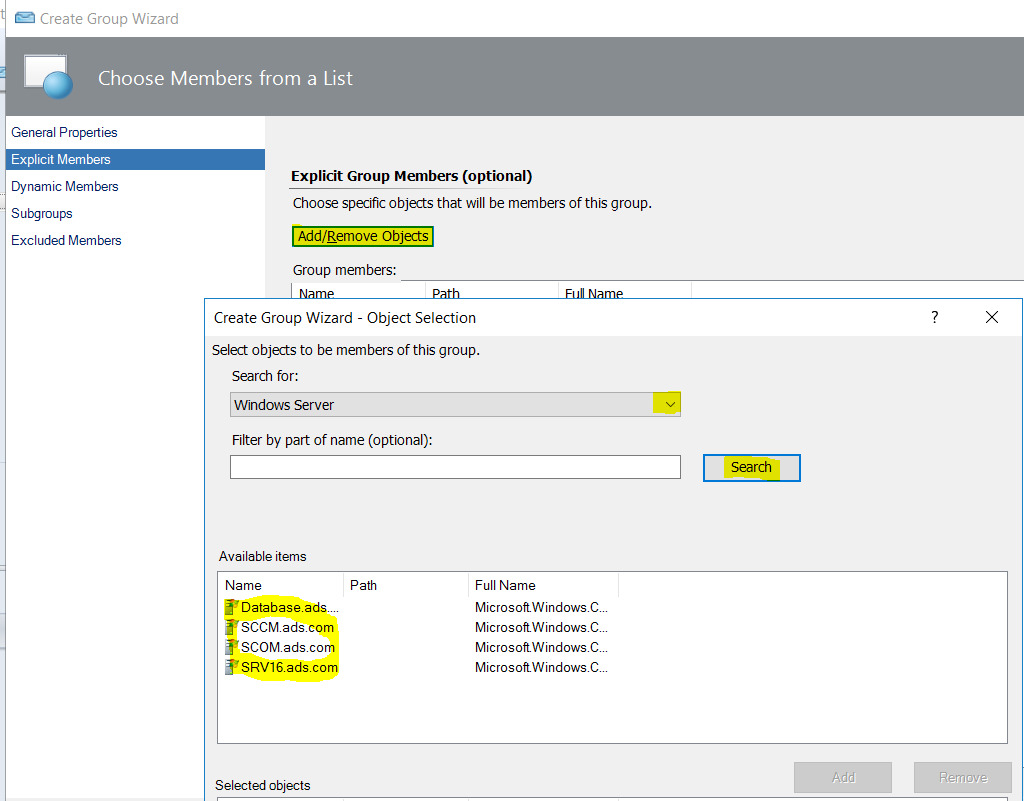
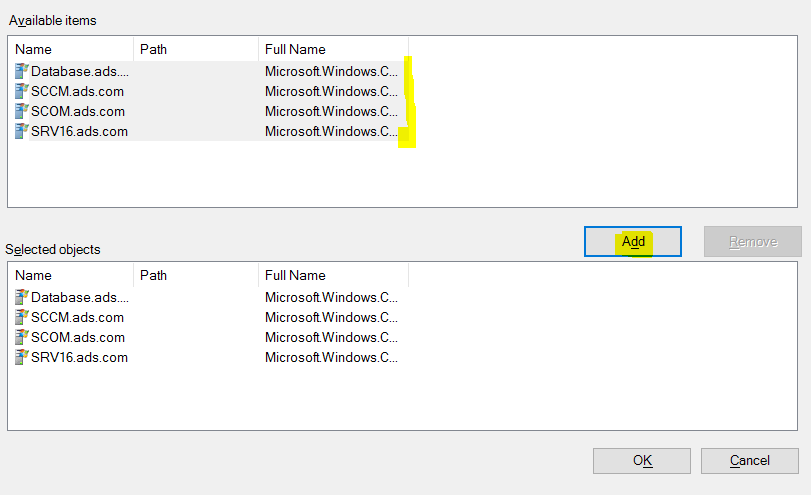
Select Available item and click ADD


Click Next


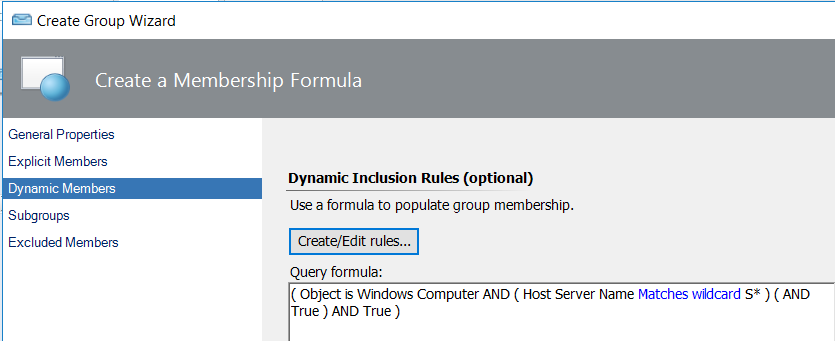
Now Click Create/Edit rules

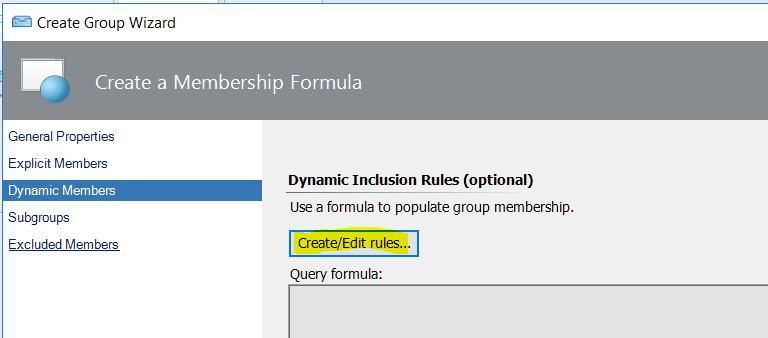
Select Desire class -> Click Add


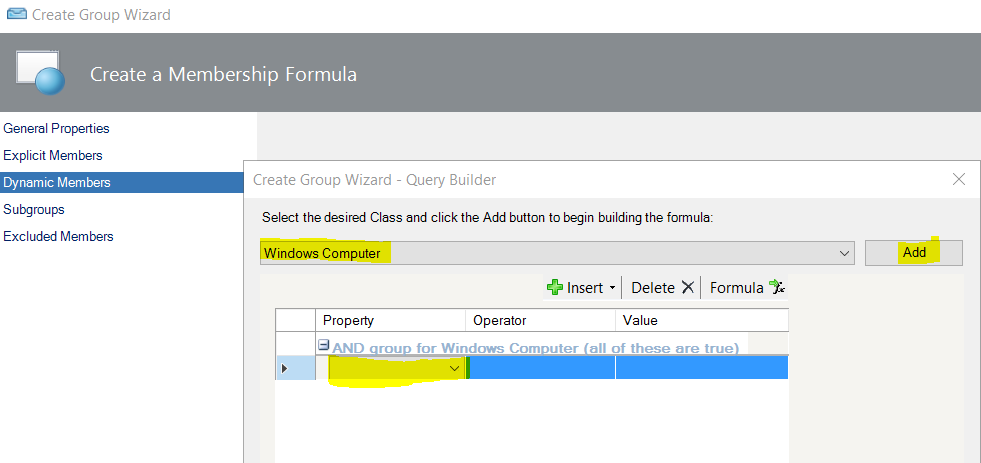
Define the expression


Click Apply Ok


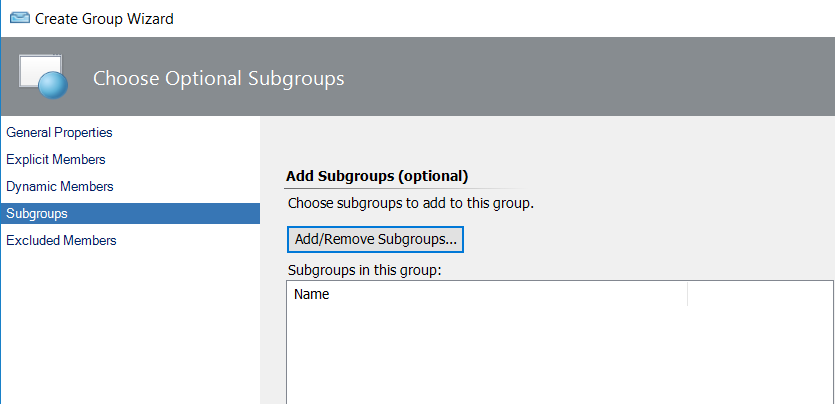
If you want to Add/Remove Subgroups click and configure else skip it.


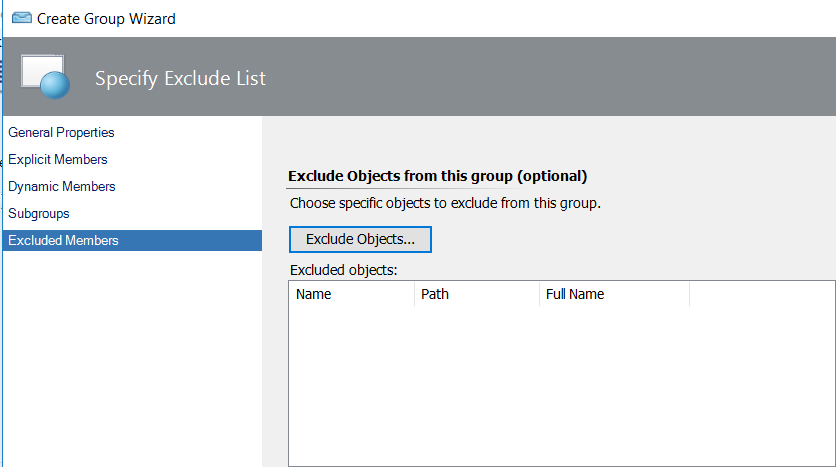
If you want to exclude any object just click else click next


Group has been created


Thank you all!


What is Rule in SCOM - How Rule work in SCOM - Types of Rule in SCOM and How to Create Event Based Rule in SCOM 2019

 In this blog I will cover what is Rule in SCOM, how does it work? Types of Rule in SCOM and how to create event based rule in SCOM 2019


What is Rule in SCOM?


Rule, basically define what you want to monitor. They define the data to collect and describe how to process and respond to that data.


The rules exist to perform various functions in operations manager, although,


That rule does not affect the state of an object where a monitor does impact the state of an object.

Rules that generate alerts don’t auto close. 


How do rules work?

For example, when you create an event based rule to configure and alert generating rule, as soon as you configure an event based rule.

Whenever an event is getting generated on the targeted object, that event is being captured by this rule and the condition, when the condition is met and alert data is being sent to the operations manager to trigger an alert in the operations console.


How to create a Rule in SCOM?

Login to SCOM Console -> Click Authoring


Under management pack -> click Rules


Right Click and select create a new rule


Here I am selecting event based alert

Select NT EventLog -> From Management pack list drop down and select Custom Management pack for overwrite.


Rule Name-> Type Rule Name

Rule Category -> Drop down and select from the list

Rule Target -> Browse and Select from list – Here I am selecting Windows Computer


Uncheck Rule is enabled -> By default it will be enabled. -> Next

Log Name -> Browse and search for Computer where you want to apply this rule – Here I am applying on SCCM.ads.com 

From Available event logs select System 


Click Ok -> Next

In EventID -> Enter Event number

In EventSource -> Enter Source 

Note -: you can refer any system based event from any server like below


You can change Priority and Severity as per your requirement.


Click create button 


Search the newly created rule Service Control Manager-test

By default newly created rules apply on all classes, you need to select the correct class that you had selected during creation.


Right click and select Overrides -> Override the Rule -> For all objects of another class

Note-: you can select as per your requirement like single or group or all objects


Search Windows Computer


Check mark on Enabled Parameter Name and change the Override Value to True


Click Apply and Ok


Now Rule has created and enabled -: Go to Monitoring tab and see Active Alert


SCOM Monitor types - Create Unit Monitor for Monitor Windows Service availability in SCOM 2019


SCOM Monitoring

KPI in SCOM – There are four types of KPI in SCOM Processor, Memory, Days and Network.

Using these KPI you can understand or you can find out the overall health of the server.

What is Monitor in SCOM -:  Basically monitor works on state based like healthy, warning and critical and measures the health of some aspects of managed objects.


Unit Monitoring -: So that's basically the most common monitor which is being used in SCOM by your admins to create, monitoring for any specific object or any specific entity.

When we refer to monitors, we usually refer to unit monitors.

Only a unit monitor also measures some aspects of an application.

Dependency rollup monitors -: Dependency monitors let the health of one object be affected 

by the health of another object. This allows for health rollup between specific related instances 

of different classes.


Aggregate rollup Monitor-: Aggregate monitors group multiple monitors to provide a single 

Health aggregated health state. This provides an organization to all of the monitors targeted at 

a particular class and provides a consolidated health state for specific categories of operation.


How to create Unit based Monitor -:

Login to SCOM operation manager Console ->

Click Authoring

Click Monitors -> Right click and select create Monitor -> Select Unit Monitor


You can select from list which types of monitoring do you want to create, here I am selecting Basic service Monitoring to create to monitor print spooler service


Drop down Management Pack and select Custom management pack for overwrite -> Click next


Give the Name for the monitor you are creating


From Monitor target -> click on select and select the appropriate target from the list.


Drop down and select from parent monitor -> select Availability (In my case it’s service availability)


Click browse button for assign service name 


Click Next


Check mark on Generate alerts for this monitor


Then click Create -> Once created search for the created Unit monitor.


Select the newly created Unit monitor and click Enable


Select for the newly created Unit Monitor -> Right click and select Overrides -> Select Override the monitor -> 


Click for all objects of another class  -> below box will open -> check mark on Enabled and apply Ok.


Now Print Spooler Monitoring rule has created ->

Now login to any of the machine and stop Print Spooler service 

Here I have logged in database.ads.com machine


Select the service from list -> Right click and stop the service


Now go to the Monitoring console in SCOM -> Click active alert and you will see one alert has triggered.


Now go back to Database.ads.com and start Print Spooler service.


Again go to the monitoring console and see active alert -> it should auto close and server status should reflect health.


All done!

Thank you.


Featured Post

HPE MSA 2040 configuration step by step

HPE MSA 2040 configuration Default IP range for HP SAN storage MSA 2040 is 10.0.0.1/2 You need to connect your laptop and storage with...